The ‘Planning’ tab include a story point burn down chart.
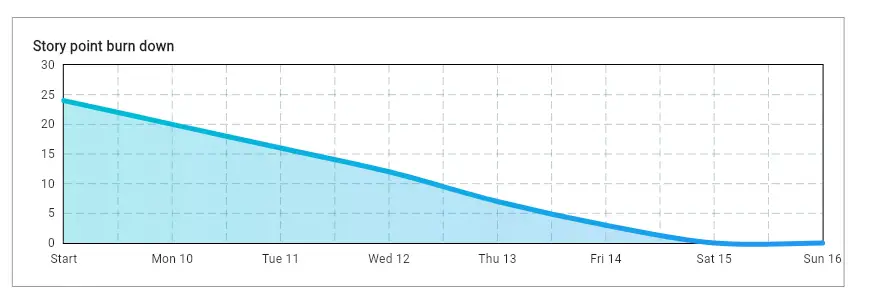
A well balanced plan would show this burn down chart as a relatively straight line that descends on a consistent angle down to zero at the end of plan.
If the line is not consistent, then this represents a scheduling risk. The burn down chart shown below is an example where the scheduled tasks are evenly distributed across the week.
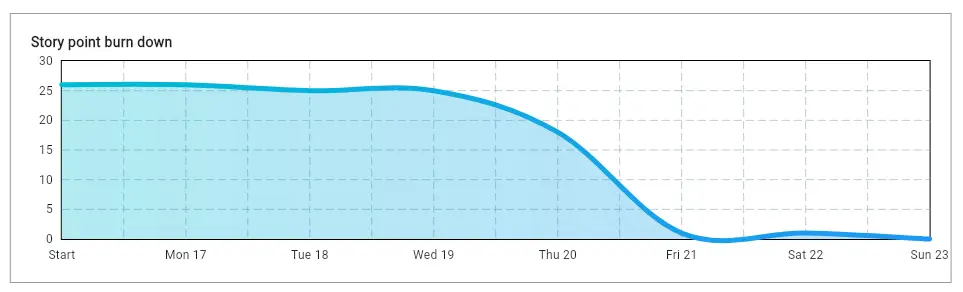
Actions to mitigate this risk include:
- Removing tasks from the plan and rescheduling tasks across the plan period to achieve a balanced distribution
- Decomposing large tasks into smaller tasks. The easiest way to accomplish this is to use the Checklist feature to identify the steps to complete the task, and then the Checklist ‘Promote’ feature to replace the old large task with a new series of smaller tasks.


